Overview
This project investigates how AI maturity has evolved across 10 industries and 15 countries over a decade (2015-2025). The central question driving the analysis: does geography or industry have a stronger influence on AI adoption levels?
Working from a corporate AI adoption dataset, I engineered group time series aggregations, computed industry-level Compound Annual Growth Rates (CAGR), and produced a suite of interactive visualisations to surface actionable insights about the global AI landscape.
Buisness Questions Addressed
- How has AI maturity changed across industries from 2015 to 2025?
- Which industries show the highest level of AI maturity, and which are adopting AI the fastest?
- How does AI maturity vary across countries, and do developed economies consistently outpace emerging ones?
- Does geographical location play a meaningful role in AI maturity levels?
- How do industry and geography interact to influence AI maturity?
- Which country-industry combinations show the highest and lowest maturity?
- Which sectors are experiencing the fastest AI transformation (by CAGR)?
Methodology
Data Preparation
import pandas as pd
import plotly.express as pxx

df = pd.read_csv('corporate_ai_adoption_dataset.csv')

# coerce year column to numeric and drop incomplete records

df['year'] = pd.to_numeric(df['year'], errors='coerce')
df = df.dropna(subset=['industry', 'country', 'ai_maturity_score', 'ai_adoption_level'])
Why this matters: Coercing the year column and removing nulls in key analytical columns ensures that all downstream aggregations and groth calculations operated on clean, consistent data. Preventing silent errors in the CAGR computation.
Feature Engineering - CAGR by Industry
To quantify the pace of AI adoption (not just current levels), I computed the Compound Annual Growth Rate for each industry’s mean AI maturity score over the full 10-year window.
# CAGR = (Ending Value / Beginning Value)**(1 / Number of Years) - 1
growth = industry_trends.groupby('industry').apply(
    lambda x:
    (
        (x.loc[x['year'] == 2025, 'ai_maturity_score'].values[0] /
        x.loc[x['year'] == 2015, 'ai_maturity_score'].values[0]) ** (1/10) - 1
    )
).reset_index(name='CAGR')
CAGR was used instead of year-over-year growth because it provides a smoother, single growth rate over the full period. This makes it easier to compare industries fairly and is commonly used in finance and business planning to assess long-term growth.
Aggregations
# Industry-level and country-level time series
industry_trends = df.groupby(['industry', 'year'])['ai_maturity_score'].mean().reset_index()

country_trends = df.groupby(['country', 'year'])['ai_maturity_score'].mean().reset_index()

# Cross-dimensional  breakdown
country_industry = df.groupby(['country', 'industry'])['ai_maturity_score'].mean().reset_index()
Visualisations
Five interactive charts were produced using Plotly Express:
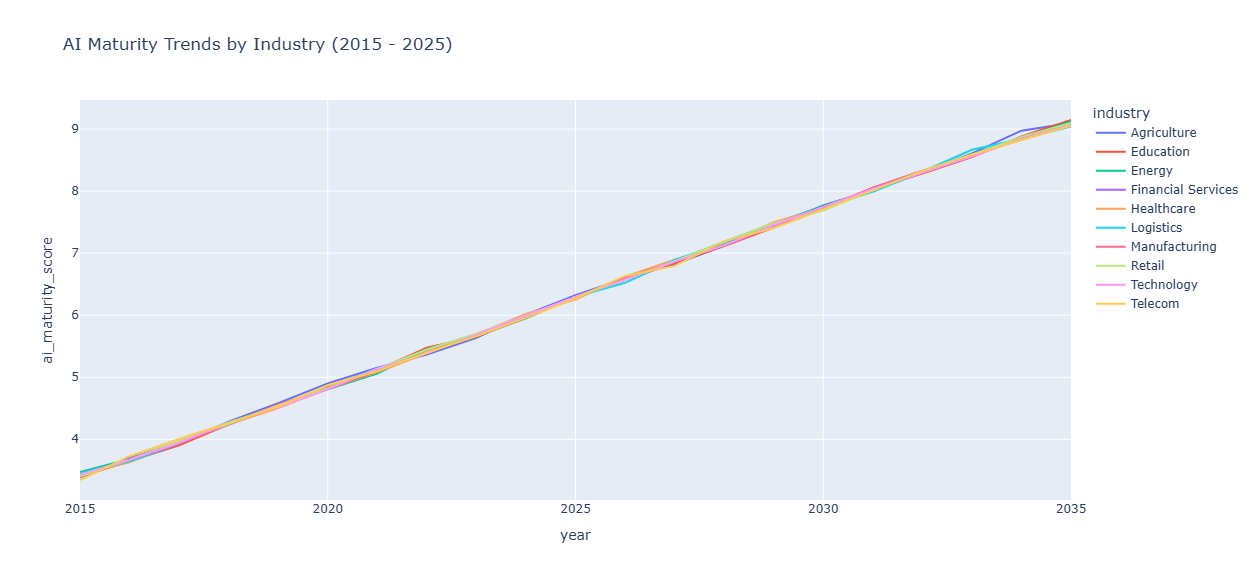
- AI Maturity Trends by Industry (2015-2025)
Purpose: Track industry-level maturity trajectories over time.
fig = px.line(
    industry_trends,
    x='year', y-'ai_maturity_score',
    color='industry',
    title="AI Maturity Trends by Industry (2015 - 2025)"
)

fig.show()
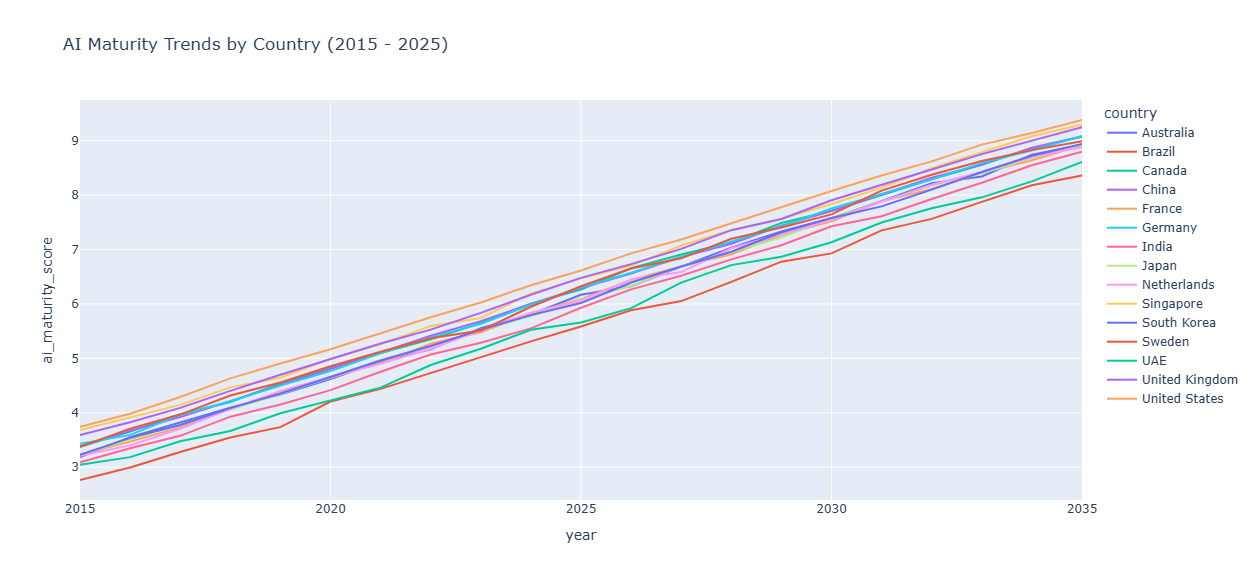
- AI Maturity Trends by Country (2015 - 2025)
Purpose: Compare national adoption curves across the decade
fig = px.line(
    country_trends,
    x='year', y-'ai_maturity_score',
    color='country',
    title="AI Maturity Trends by Country (2015 - 2025)"
)

fig.show()
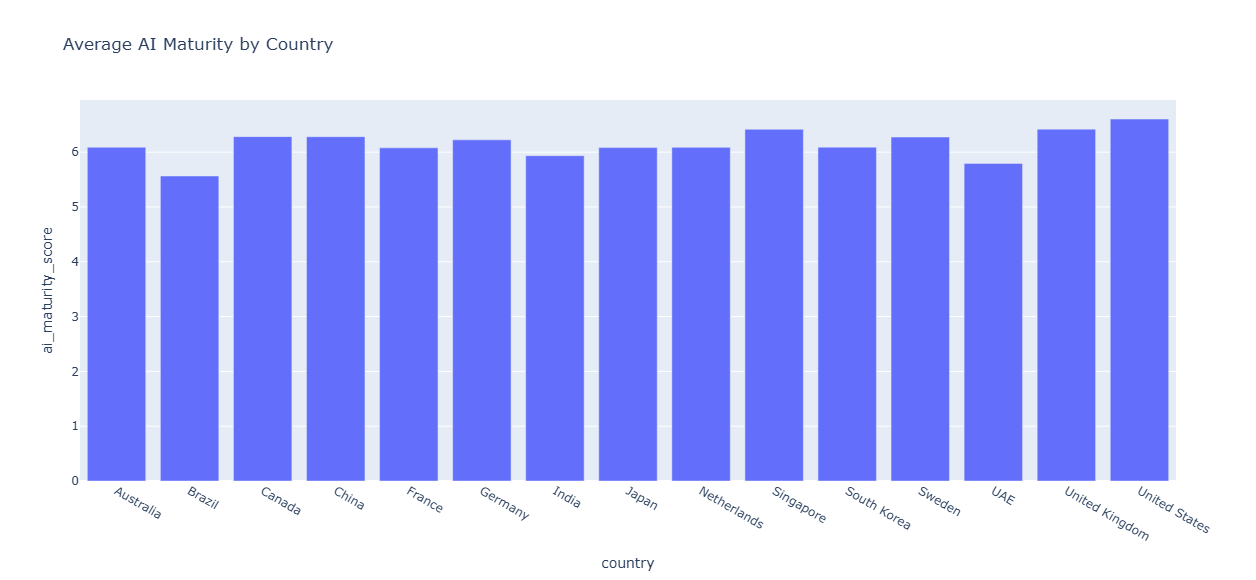
- Average AI Maturity by Country
Purpose: Rank countries by mean maturity score
country_avg_df = (
    df.groupby('country')['ai_maturity_score'].mean().reset_index()
)
fig = px.bar(
    country_avg_df,
    x='country',
    y='ai_maturity_score',
    title='Average AI Maturity by Country'
)

fig.show()
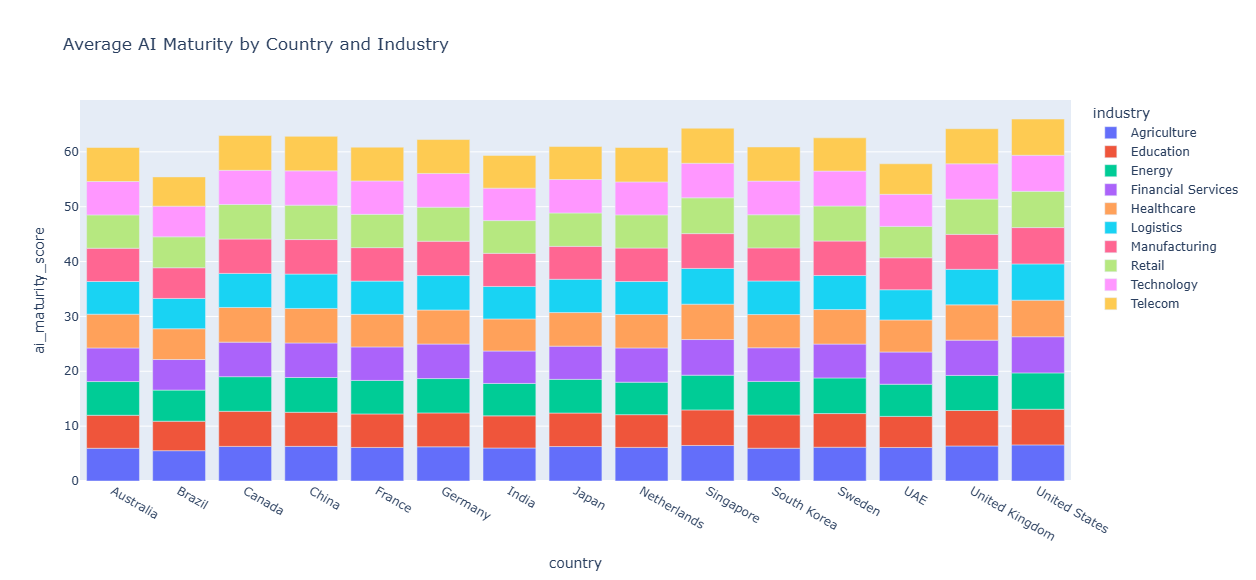
- Average AI Maturity by Country and Industry
Purpose: Surface country x industry interaction effects
fig = px.bar(
    country_industry,
    x='country',
    y='ai_maturity_score',
    color='industry',
    title='Average AI Maturity by Country and Industry'
)

fig.show()
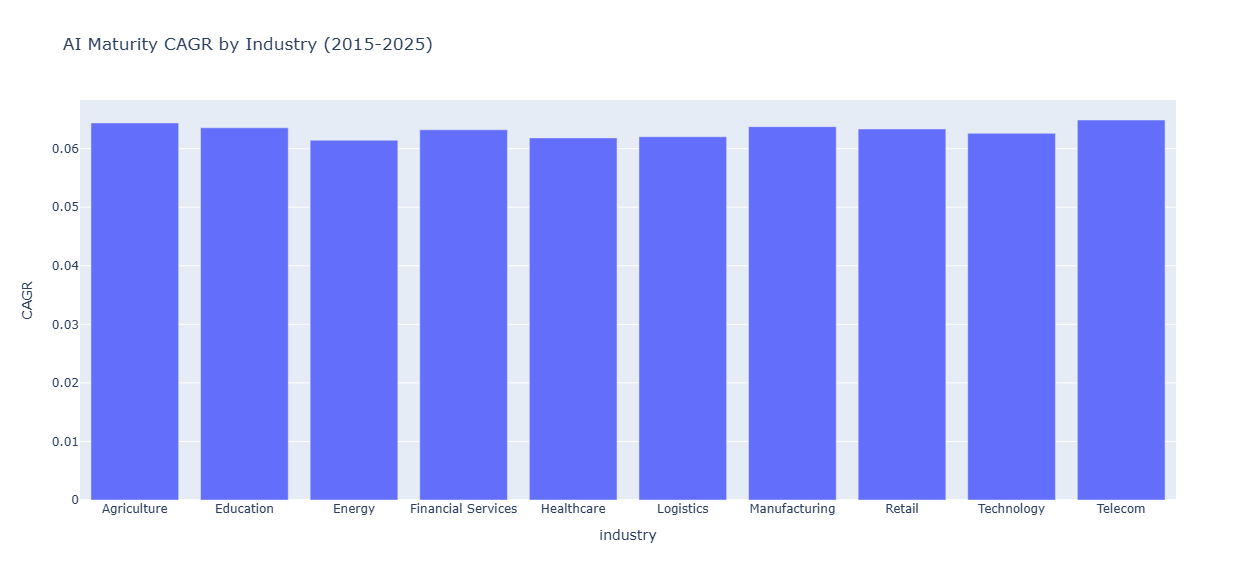
- AI Maturity CAGR by Industry (2015 - 2025)
Purpose: Identify fastest-growing sectors by growth rate
cagr_fig = px.bar(
    growth,
    x='industry',
    y='CAGR',
    title='AI Maturity CAGR by Industry (2015-2025)'
)
cagr_fig.show()
Key Findings
1. Industry Maturity in 2025 - Rankings
| Industry | AI Maturity Score (2025) |
|---|---|
| Agriculture | 6.32 <- Highest |
| Energy | 6.30 |
| Technology | 6.30 |
| Financial Services | 6.30 |
| Manufacturing | 6.30 |
| Logistics | 6.30 |
| Retail | 6.29 |
| Education | 6.29 |
| Telecom | 6.27 |
| Healthcare | 6.25 <- Lowest |
Insight: Agriculture recorded the highest AI maturity score in 2025. This suggests that AI adoption in agriculture has grown significantly over the period. Healthcare, despite its investment in technology, showed lower maturity scores compared to several other industries.
2. Fastest-Growing Industries by CAGR
| Industry | CAGR (2015 - 2025) |
|---|---|
| Telecom | 6.49% <- #1 |
| Agriculture | 6.44% |
| Manufacturing | 6.38% |
| Education | 6.36% |
| Retail | 6.34% |
Insight: Telecom recorded the highest compound annual growth rate (CAGR) in AI maturity between 2015 and 2025, slightly ahead of Agriculture. The top five industries all showed similar growth rates (around 6.3%–6.5%), suggesting that AI adoption increased steadily across multiple sectors rather than being driven by a single industry.
3. Country-Level AI Maturity - Rankings
| Country | Avg. AI Maturity Score |
|---|---|
| United States | 6.60 <- #1 |
| United Kingdom | 6.42 |
| Singapore | 6.42 |
| Canada | 6.28 |
| China | 6.28 |
| Sweden | 6.28 |
| Germany | 6.23 |
| South Korea | 6.09 |
| Australia | 6.09 |
| Netherlands | 6.09 |
| Japan | 6.08 |
| France | 6.08 |
| India | 5.94 |
| UAE | 5.80 |
| Brazil | 5.57 <- Lowest |
Insight: The ranking shows a concentration of higher AI maturity scores among countries with established technology sectors, including the United States, United Kingdom, and Singapore. This may reflect greater access to AI talent, digital infrastructure, and investment. However, the relatively narrow range between the highest score (6.60) and the lowest score (5.57) suggests that AI adoption is not limited to a small group of countries. Adoption appears to be expanding globally, with most countries showing comparable levels of maturity.
4. Does Geography Drive AI Maturity?
Average AI maturity scores varied more across countries than across industries. Country scores ranged from 5.57 (Brazil) to 6.60 (United States), while industry averages remained relatively close together. This suggests that geographical location may have a greater influence on AI maturity than industry type. Factors such as access to technology, digital infrastructure, investment, and skilled talent may contribute to these differences.
Debugging & Problem-Solving
This section is included intentionally.
| Error | Root Cause | Resolution |
|---|---|---|
FileNotFoundError: corporate_ai_adoption.csv |
Wrong filename - dataset uses _dataset suffix |
Corrected to corporate_ai_adoption_dataset.csv |
AttributeError: module 'pandas' has no attribute 'to_numerical' |
Typo - correct method is to_numeric |
Corrected to pd.to_numeric() |
ValueError: 'aimaturity_score' is not a column |
Missing underscore in column name | Corrected to ai_maturity_score |
NameError: 'fig' is not defined |
Attempted fig.show() before figure was assigned |
Reordered code to define figure before calling .show() |
| CAGR formula dividing 2025 by 2025 | Copy-paste error - both values referenced year==2025 |
Corrected denominator to year==2015 |
Files
| File | Description |
|---|---|
| Python.py | Full analysiis script |
| Dataset.csv | Source dataset |