Overview
The FIFA World Cup is the most prestigious international football tournament, bringing together nations from around the world every four years. Over the decades, the tournament has expanded significantly in size and popularity.
This project explores the evolution of the FIFA World cup from 1930 to 2022 using Python-based data analysis techniques. The analysis examines tournament growth, scoring trends, country performance, and the impact of tournament expansion on overall goal production.
Using Exploratory Data Analysis (EDA), trend analysis, comparative analysis, and correlation analysis, I investigated how the competition has changed over nearly a century. Key areas of focus include growth in participating teams, chnages in goals scored per matches, historical dominance of winning nations, and the relationship between match size and scoring output.
The project was developed using Python, Pandas, and Matplotlib, with fidings presented through data visualizations and statistical insights to tell the story of the World Cup’s development over time.
Questions Addressed
- Has the number of participating teams increased over time?
- Did the increase in participating teams lead to more goals being scored?
- Has the number of matches increased over time?
- Which world cup has the most goals?
- Which country has won the most world cups?
- Which countries frequently reach the final?
- How often does the host nation win?
Methodology
Dataset
The dataset contains historical FIFA World Cup tournament data from 1930 to 2022, including the columns:
- Year
- Host country
- Winner
- Runner up
- Third place
- Fourth place
- Total goals
- Matches played
- Teams
- Goals per match
Data Preparation
import pandas as pd
import matplotlib.pyplot as plt

df = pd.read_csv('fifa_world_cup_history.csv')

df.head(5)
df.info()
df.describe()
The initial exploration of the dataset was performed using:
- Data inspection
- Data structure analysis
- Summary statistics
This helped validate the dataset structure and understand the available variables before conducting deeper analysis (column datatype, empty cells/ null values, mean of a column with numerical values)
Trend Analysis
Trend analysis was used to evaluate how the World Cup has evolved over time by examining:
- Participating teams
- Matches played
-
Goal-scoring patterns
- Has the Number of Particiapting Teams Increased Over Time?
A line chart was created to visualize the number of participating teams across all World cup tournaments.
df[['Year', 'Teams']]

plt.figure(figsize=(10, 5))
plt.plot(df['Year'], df['Teams'], marker='o')
plt.title('Number of Participating Teams Over Time')
plt.xlabel('Year')
plt.ylabel('Number of Teams')
plt.grid(True)

plt.show()
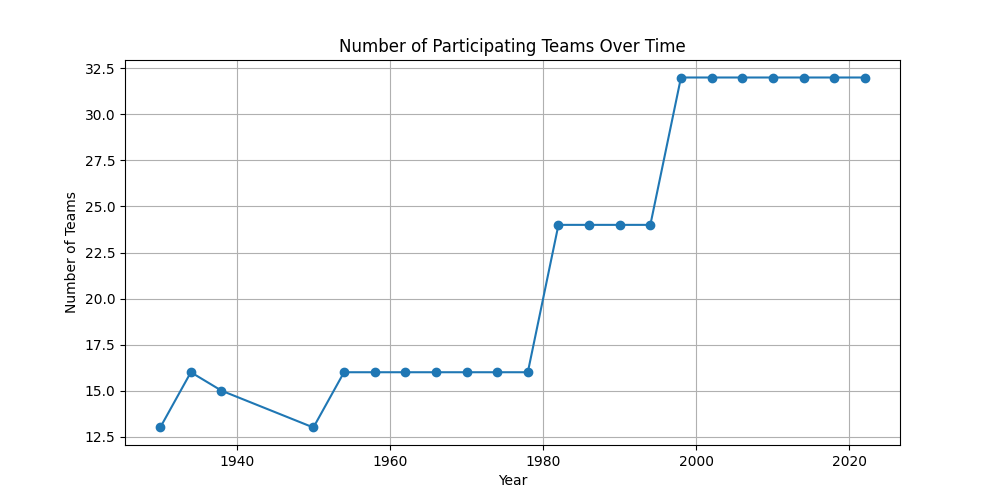
The analysis shows that FIFA has progressively expanded participation over time, making the competition more globally inclusive and increasing opportunities for nations to compete in the world cup.
- Did More Participating Teams Lead to More Goals Being Scored?
A scatter plot was created to examine the relationship between the number of teams and total goals scored.
df[['Teams', 'Total_Goals', 'Year']]

plt.scatter(df['Teams'], df['Total_Goals'])
plt.xlabel('Teams')
plt.ylabel('Total Goals')
plt.show()
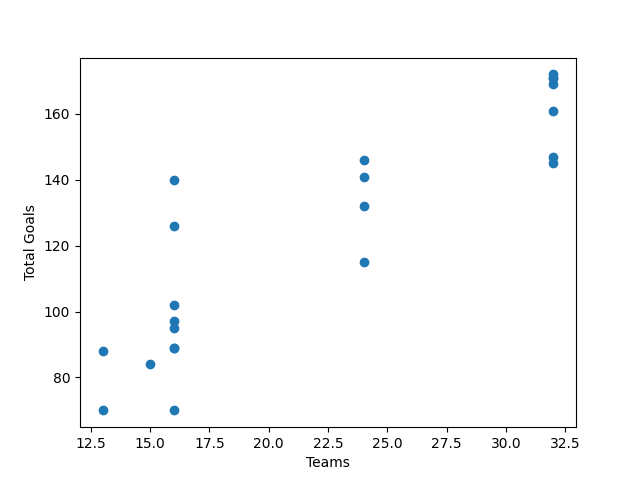
A correlation coefficient was then calculated.
df[['Teams', 'Total_Goals']].corr()
The correlation value between Teams and Total Goals is 0.89. This indicates a strong positive relationship between the tournament size and total goal scored. As more teams participated, the total number of goals generally increased. However, this increase is likely influenced by the larger number of matches played in expanded tournaments, which creates more scoring opportunities.
- Did More Teams Lead to More Goals Per Match?
To determine whether tournament expansion affected scoring efficiency, a second correlation analysis was performed between the participating team and average goal scored per match.
df[['Teams', 'Goals_Per_Match']].corr()
The correlation value between Teams and Goals Per Match is -0.61. This indicates a moderate negative relationship. While larger tournaments produced more total goals, the average number of goals scored per match tended to decrease as the number of participating teams increased. This suggests that tournament expansion inscreased total scoring volume through additional matches rather than increasing scoring intensity within individual games.
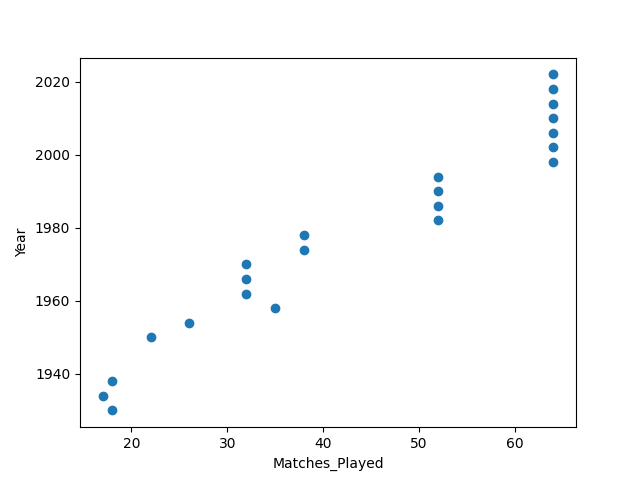
- Has the Number of Matches Increased Over Time?
The relationship between tournament year and matches played was analysed to understand how competition structure evolved.
df[['Year', 'Matches_Played']]

plt.scatter(df['Matches_Played'], df['Year'])
plt.xlabel('Matches_Played')
plt.ylabel('Year')
plt.show()
start = df.iloc[0]['Matches_Played']
end = df.iloc[-1]['Matches_Played']

increase_matches_percent = (
    ((end - start) / start)
) * 100

print(increase_matches_percent)
Matches increased from 18 in 1930 to 64 in 2022, ths represents an increase of approximately 255.56%. Since 1998, the tournament has consistently featured 64 matches. The increase in participating nations directly contributed to a larger tournament structure and significantly more matches.
- Which World Cup Tournament Recorded the Most Goals?
The tournament with the highest total goals scored was identified using the maximum value in the Total_Goals column.
df.loc[df['Total_Goals'].idxmax()]
In the year, 2022, FIFA World Cup recorded the highest total goals of 172, with an average of 2.69 goals per match.
- Which Country Has Won the Most World Cups?
A frequency analysis was conducted on tournament winners.
df['Winner'].value_counts()
| Winner | Score |
|---|---|
| Brazil | 5 |
| Italy | 4 |
| West Germany | 3 |
| Argentina | 3 |
| Uruguay | 2 |
| France | 2 |
| England | 1 |
| Spain | 1 |
| Germany | 1 |
Brazil has won the FIFA World Cup a total of 5 times, Italy and West Germany follow with 4 and 3 titles repectively. The results highlight Brazil’s historical dominance and consistent success across multiple generations of football.
- Which Countries Most Frequently Reaches the Final Stages?
The Winner, Runner-Up, Third Place, and Fourth Place columns were combined to identify nations that consistently perform at the highest level.
finalists = pd.concat([
    df['Winner'],
    df['Runner_Up'],
    df['Third_Place'],
    df['Fourth_Place']
])

final_counts = finalists.value_counts()

final_counts.head(5)
| Country | Count |
|---|---|
| Brazil | 11 |
| Italy | 8 |
| West Germany | 8 |
| France | 7 |
| Argentina | 6 |